Featured Image: close up of Paria Waterfall, Trinidad by SLRoss
28 Dec 2019
How I analysed my data
I have a funny feeling my data analysis isn’t as fully developed as it could be. The main reason for this feeling is how close my initial thoughts on analysis were to the information I read about data analysis.
Pre-reading, I thought I’d just go through my data looking for things each source had in common and keep funnelling that “stuff in common” until I had distilled the most repeated aspects of organising a large-scale exhibition so I could see what everyone agreed was “the best way” to approach such an exhibition.
Post-reading, I’m left wondering whether there was something else I should have done with respect to my analysis. Of course, by the time the deadline came into the equation, I was even less inspired to go experimenting with analysis techniques. I now had names for all the analysis ideas I had before. Although I learned about other ways that analysis could be done, it didn’t really change my planned approach, which from the readings, seemed to fit my research project pretty well.
Let me show you what I mean.
Below is a drawing of how I planned to analyse my data. There are no ‘technical terms’ noted on the diagram, which is a neatened up version of a scrappy virtually illegible one I made sometime in November when this project started taking shape in my head.
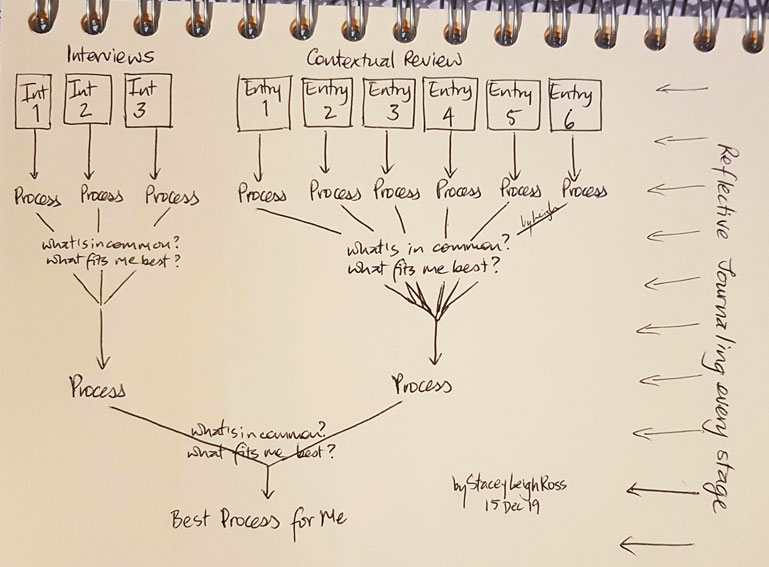
At the top of the diagram I list my primary methods of research and data collection – Interviews and Contextual Review and the double whammy collection and analytical tool, Reflective Journaling. I plan to go through each data source within each research method and extract a process map that will give me an idea of how the data source approached the curation of a large-scale social change exhibition. This move from
“particular observations to empirical generalisations” (Harvey, 2019) is considered an inductive approach. My inductive process focuses on pulling out any data that shows the steps taken on their journey to a finished exhibition. Post-reading I realised that this is a form of data reduction – “any structures/tools that encourage you to sort, select, focus, order, simplify data” (Gray and Malins, 2017, pp.144)
My next step once I’ve reduced my raw data to a process map (I don’t follow process chart shape rules), is to compare the processes I extract from each source. The process maps are a form of data display that make comparison more manageable. Also, helping with this is my decision to make comparisons in groups. I compared the interviewee processes first, then I compared practice review sources’ process maps next.
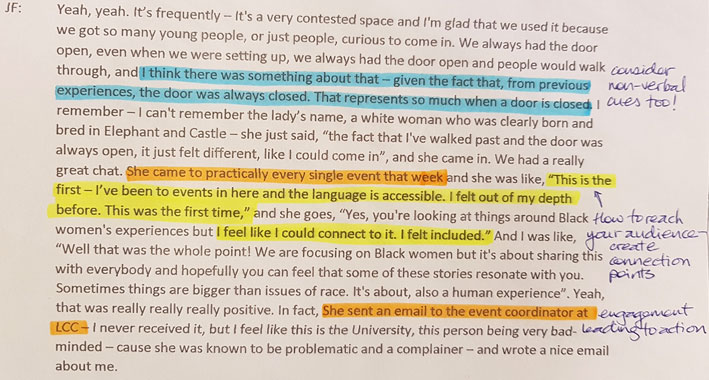
To help me compare, there is some measure of thematic coding/analysis (Mortensen, 2019) taking place. In my interview transcripts I coded the information that was important to my research question by assigning a colour to highlight data that served each part of the question.
This is how that looked in practice. My research question is:
How do I structure a large-scale exhibition
that inspires visitors to social change action?
Blue highlighted data could answer the ‘how to structure’ aspect of my question.
Yellow highlighted data could answer the ‘how to inspire’ aspect of my question.
Orange highlighted data could answer the ‘how to generate action’ aspect of my question.
Various themes
did appear in both the Interview Transcripts and Contextual Review like:
- Art & Artists
- Venue
- Caring for your Team
- Roles
- Idea/Concept Emergence & Development
- Funding
- Programme/Sequence of Events
- Concept Testing
- Exhibition Proposal/Pitch, and more
These themes are certainly worth exploring and could potentially be a research project in their own right but I had to maintain focus on my current research question and that was not about determining how to address and define each of these themes, but when to consider them in my curation process. So I didn’t code for these. I coded for my question.
“One of the advantages of thematic analysis is that it’s a flexible method which you can use both for explorative studies, where you don’t have a clear idea of what patterns you are searching for, as well as for more deductive studies, where you know exactly what you are interested in.” (Mortensen, 2019)
Still I noticed some key concepts popping up over and over so many times I couldn’t ignore them, which led me to listing them all in a side document that eventually became known as my Social Change Curators’ Manifesto. Let’s call it my future to-do list!
In addition to this coding for themes in my research question, I also sought out patterns. Was there anything that numerous sources did first? Which activities should always be complete early in the process and which ones later on? The last factor I used for reducing the data to fewer process maps was how well the curation approach fit me.
“data sets are refined into simply what a user (or set of users) needs” (Nehrey and Hnot, 2019, pp.189)
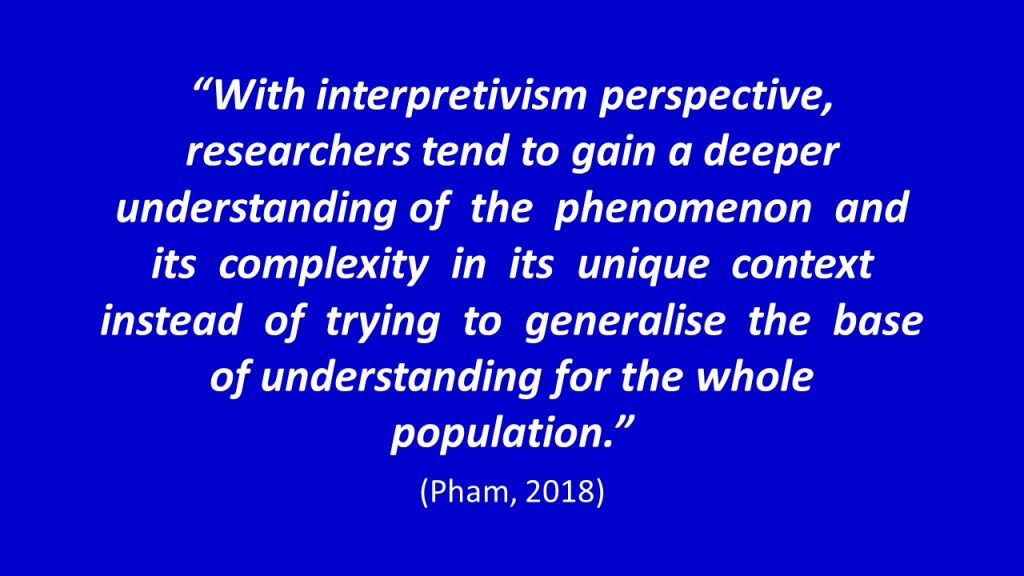
I felt this was important because this research is to help me do something I didn’t know how to do before. If one option that emerges is something I have no skill or desire to do then I eliminate that option or consider its importance to determine if I should look for an alternative way to get it done e.g. hire someone else to do what I cannot. And this is where my interpretivist approach reaches it’s height. I am doing this research for me. It is a wonderful thing that others can also benefit from it, but first and foremost this research needs to answer my question and serve my purpose. So as I eliminate conclusions that do not fit me, I am very aware that they might well fit someone else to a T. I have gone into the unique experience of each interviewee and, as much as I can, each organisation on my Contextual Review to extract information about their methods of organising themselves to curate social change exhibitions. By Pham’s definition below, this is very interpretivist because my primary aim is not to generalise the data for the whole world, just me.
So my three filters to reduce several process maps to one are:
- Identifying and ordering common themes
- Highlighting common patterns in the order of those themes
- Establishing relevance to me as a researcher and the exhibition I am aiming to produce.
These three filters would be used repeatedly until multiple process maps had been systematically refined into one final process map which I would consider my research findings. This would be the way I literally drew my conclusions to discover the ideal way to structure my exhibition.
Assessment of this Strategy
Penalties
Interviews – I only managed to do three, which is not enough to make any sort of real determination. Though, it wasn’t planned, I noticed that all three interviewees were BAME women under age 45 so my sample was only representative of a small group. Access and time played a part in selection of curators and maybe this worked in my favour? Taking the interpretivist view, as I too am a BAME woman under age 45, it could be argued that my experience is more likely to mirror theirs than, say, an older white woman? Therefore, I might not need to broaden my interviewee pool in terms of demographics, but I still think I would benefit from an increased number of interviewees.
Practice/Contextual Review – The same info was not always available for each entry in the Review and I didn’t have the time to be picky and throw out all those that couldn’t meet the full data requirements. As with any data set is some values are missing, it makes things hard to compare thoroughly. In some instances I even have to infer how an exhibition was structured because behind the scenes info on exhibition curation isn’t always readily available.
Reflective Journal – This has been excellent for teasing out individual ideas but for building a structured process to follow, it can be tricky keeping track of all the info to tie it together later on.
Perks
Process Maps – Distilling a variety of research data into a common form really helps with comparison and analysis. WIN!
Triangulation – Pulling data from 3 research methods enabled me to get 3 different perspectives. I did the same as far as possible with secondary sources, finding 2-3 sources for any information I used increased the likelihood of my final conclusion being more reliable. WIN!
Interviewees – Were not ‘big name’ curators, meaning they weren’t so out of my league that I felt it impossible to imagine doing what they did. This improved the relevance and usefulness of the data they gave me. WIN!
Reflective Journal – It really worked for me to use the combination of a notebook for scrappy notes and drawings with an online blog to tease out ideas and measure them against what I wanted to achieve, what I am capable of doing, and where my interests lie. Plus the informality of the reflective journal suited me perfectly. WIN!
—
References
Gray, C. and Malins, J. (2017). Visualizing Research : A Guide to the Research Process in Art and Design. Abingdon, Oxon: Routledge.
Harvey, L. (2019). Social Research Glossary. [online] Quality Research International. Available at: http://www.qualityresearchinternational.com/socialresearch/ [Accessed 2 Dec. 2019].
Mortensen, D. (2019). How to Do a Thematic Analysis of User Interviews. [online] The Interaction Design Foundation. Available at: https://www.interaction-design.org/literature/article/how-to-do-a-thematic-analysis-of-user-interviews [Accessed 28 Dec. 2019].
Nehrey, M. and Hnot, T. (2019). Data Science Tools Application for Business Processes Modelling in Aviation. In: T. Shmelova, N. Rizun, D. Kucherov and Y. Sikirda, eds., Advances in Computer and Electrical Engineering. [online] Pennsylvania, USA: IGI Global, p.189. Available at: https://www.igi-global.com/chapter/data-science-tools-application-for-business-processes-modelling-in-aviation/222188 [Accessed 23 Dec. 2019].
Pham, L. (2018). A Review of Key Paradigms: Positivism, Interpretivism and Critical Inquiry. [online] Researchgate.net, MEd Program 2017-2018, pp.3–4. Available at: https://www.researchgate.net/publication/324486854_A_Review_of_key_paradigms_positivism_interpretivism_and_critical_inquiry [Accessed 23 Dec. 2019].